没有永远的安全,如何在被攻击的情况下,快速响应和快速溯源分析攻击动作是个重要的话题。想要分析攻击者做了什么、怎么攻击进来的、还攻击了谁,那么日志是必不可少的一项,因此我们需要尽可能采集多的日志来进行分析攻击者的动作,甚至在攻击者刚落脚的时候就阻断攻击者。
这边根据官方文档:https://www.elastic.co/guide/en/elasticsearch/reference/current/docker.html 使用Docker安装了Elastic和Kibana
# 安装es
docker network create elastic
docker pull docker.elastic.co/elasticsearch/elasticsearch:8.12.1
docker run --name es01 --net elastic -p 9200:9200 -it -m 1GB docker.elastic.co/elasticsearch/elasticsearch:8.12.1
# 记录es的密码和注册kibana所需要的token
# 测试es是否正确运行
export ELASTIC_PASSWORD="es_your_password"
docker cp es01:/usr/share/elasticsearch/config/certs/http_ca.crt .
curl --cacert http_ca.crt -u elastic:$ELASTIC_PASSWORD https://localhost:9200
# 安装kibana
docker pull docker.elastic.co/kibana/kibana:8.12.1
docker run --name kib01 --net elastic -p 5601:5601 docker.elastic.co/kibana/kibana:8.12.1
会给出kibana的注册地址,访问填入上述记录的token即可。
不知道是机器性能问题还是Docker安装的问题,es容器经常会挂掉。
根据https://www.elastic.co/guide/en/elasticsearch/reference/current/rpm.html、https://www.elastic.co/guide/en/kibana/current/rpm.html官方文档,可以yum install安装。因为公司访问镜像源被封,因此使用上述文档中下载rpm安装:
# 安装es
wget https://artifacts.elastic.co/downloads/elasticsearch/elasticsearch-8.12.1-x86_64.rpm
wget https://artifacts.elastic.co/downloads/elasticsearch/elasticsearch-8.12.1-x86_64.rpm.sha512
shasum -a 512 -c elasticsearch-8.12.1-x86_64.rpm.sha512
sudo rpm --install elasticsearch-8.12.1-x86_64.rpm
安装kibana
wget https://artifacts.elastic.co/downloads/kibana/kibana-8.12.1-x86_64.rpm
wget https://artifacts.elastic.co/downloads/kibana/kibana-8.12.1-x86_64.rpm.sha512
shasum -a 512 -c kibana-8.12.1-x86_64.rpm.sha512
sudo rpm --install kibana-8.12.1-x86_64.rpm依然在安装es的rpm时,会吐出es/kibana的密码:
The generated password for the elastic built-in superuser is : Fq*S7jxCjFfPu6nN8NG8es服务可能启动不了,但是安装时会给出启动命令:
 sudo systemctl daemon-reload
 sudo systemctl enable elasticsearch.service
测试es启动是否正常:
export ELASTIC_PASSWORD="Fq*S7jxCjFfPu6nN8NG8"
curl --cacert /etc/elasticsearch/certs/http_ca.crt -u elastic:$ELASTIC_PASSWORD https://localhost:9200
记得改下配置文件,使其监听在0.0.0.0上面:
# /etc/elasticsearch/elasticsearch.yml
# Allow HTTP API connections from anywhere
# Connections are encrypted and require user authentication
http.host: 0.0.0.0
# Allow other nodes to join the cluster from anywhere
# Connections are encrypted and mutually authenticated
transport.host: 0.0.0.0kibana一样,记得改下配置文件,使其监听在0.0.0.0上面:
# /etc/kibana/kibana.yml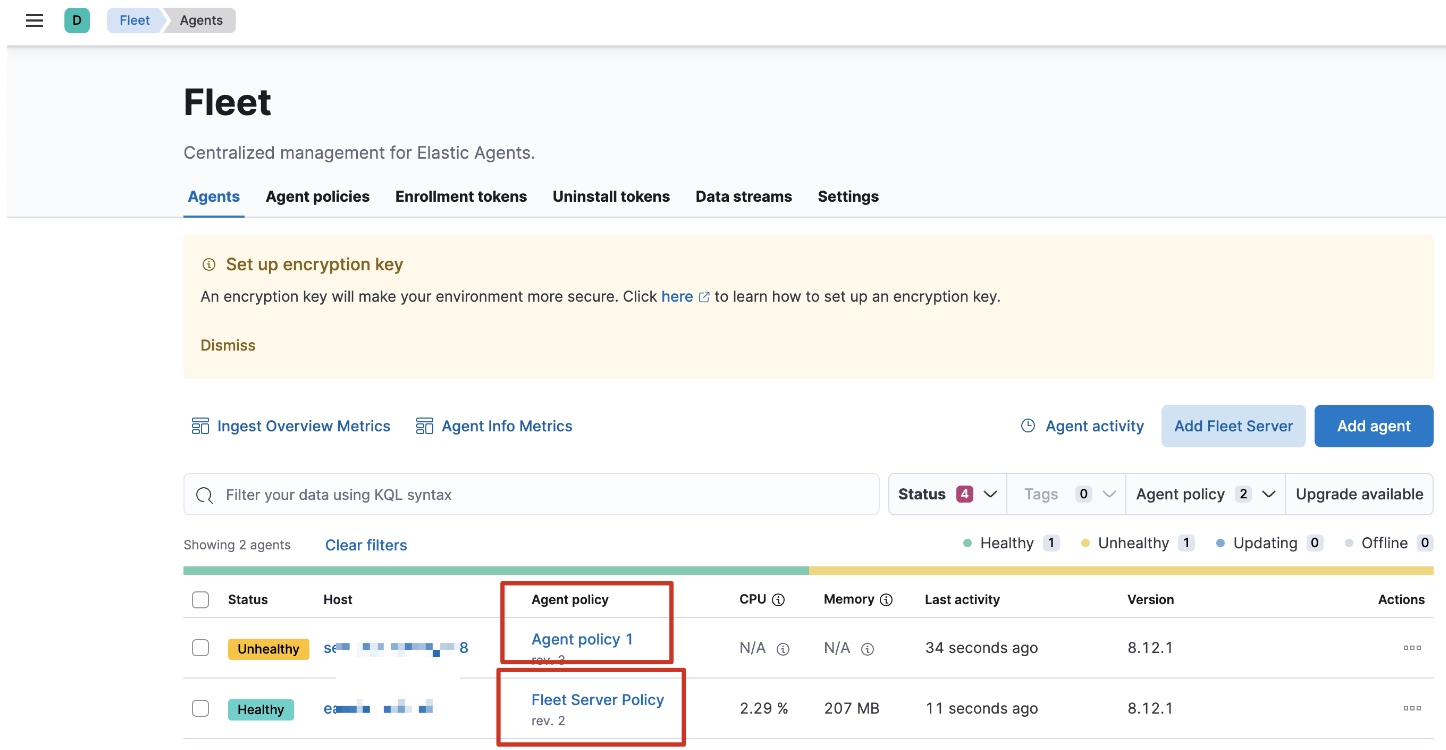
server.host: "0.0.0.0"在Kibana上,Management->Fleet->Add Fleet Server,先安装Fleet Server,URL填写https协议,端口可以填默认的8220。装好Fleet Server后再装Elastic Agent,Fleet Server也是一个Agent,因此不能在同一台机器上同时装Fleet Server和Elastic Agent。
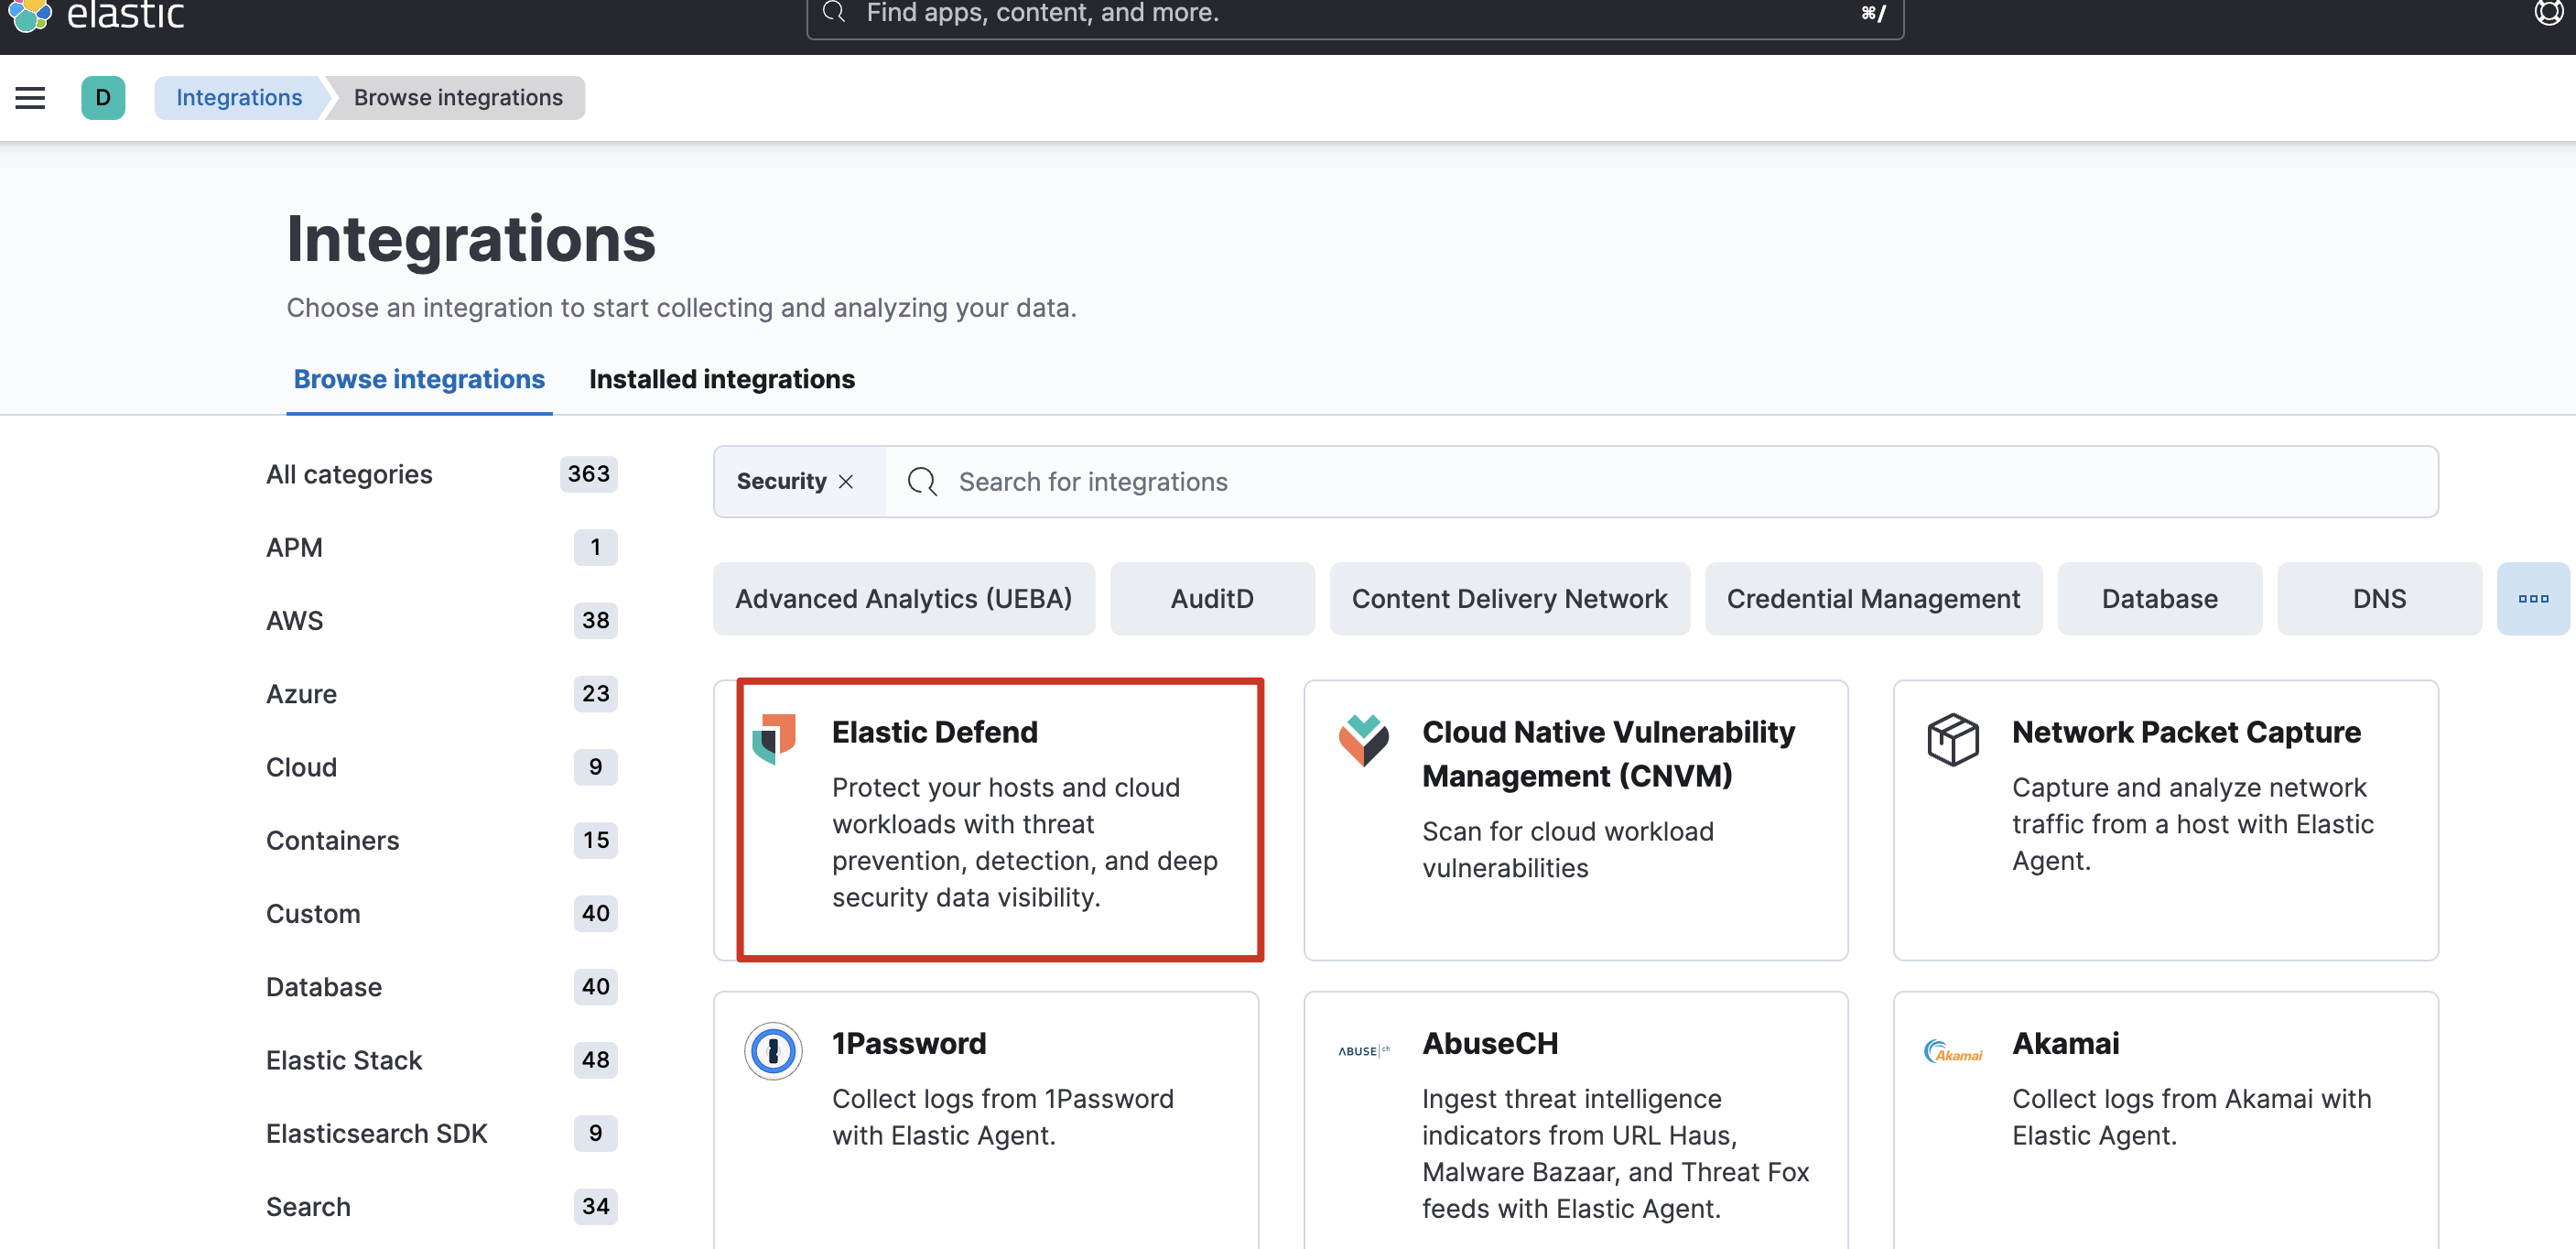
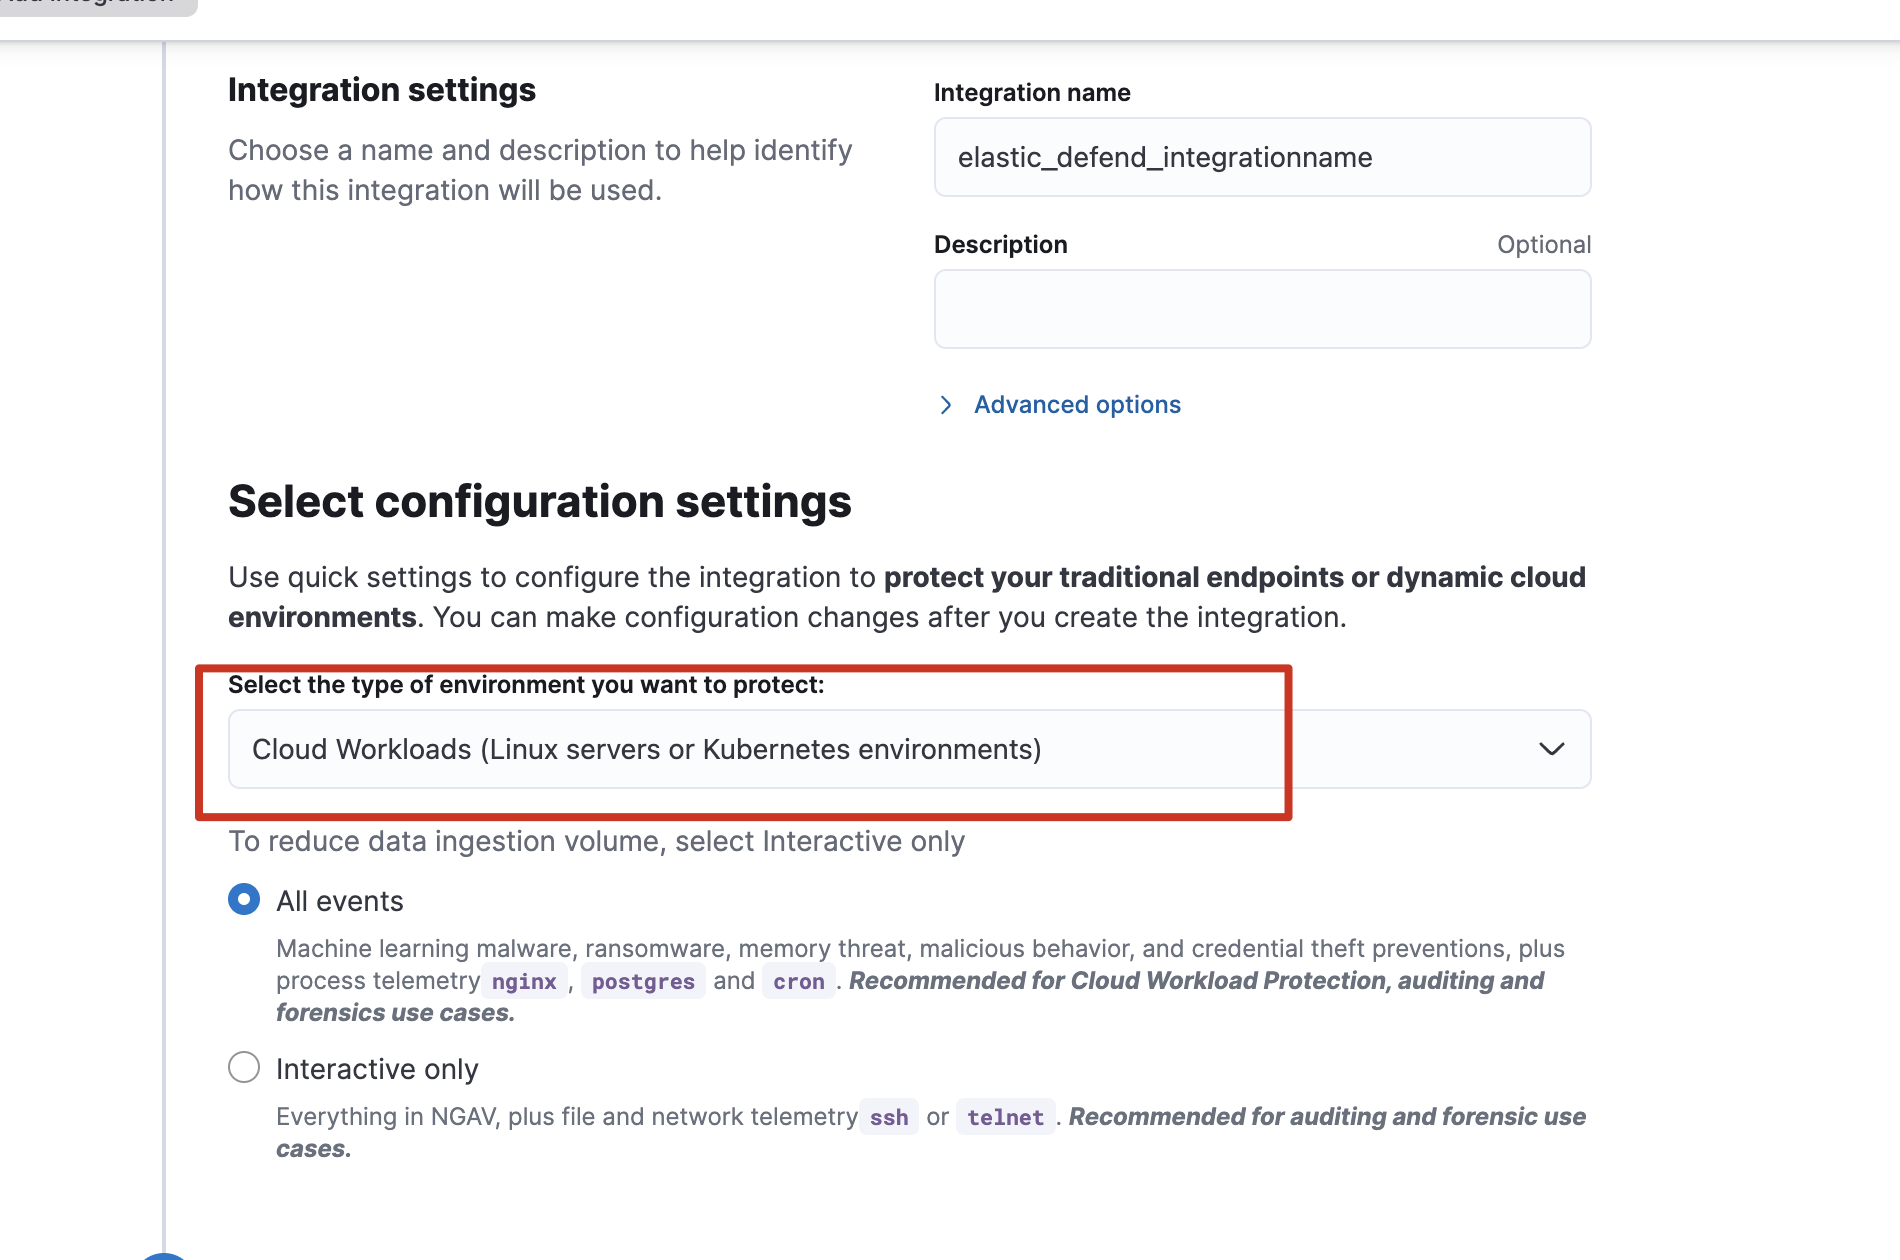
为了使其Elastic Agent附带Security能力,可以添加各式各样的integrations集成,如到Security->Manage->Get started->Add security integrations安装安全集成:
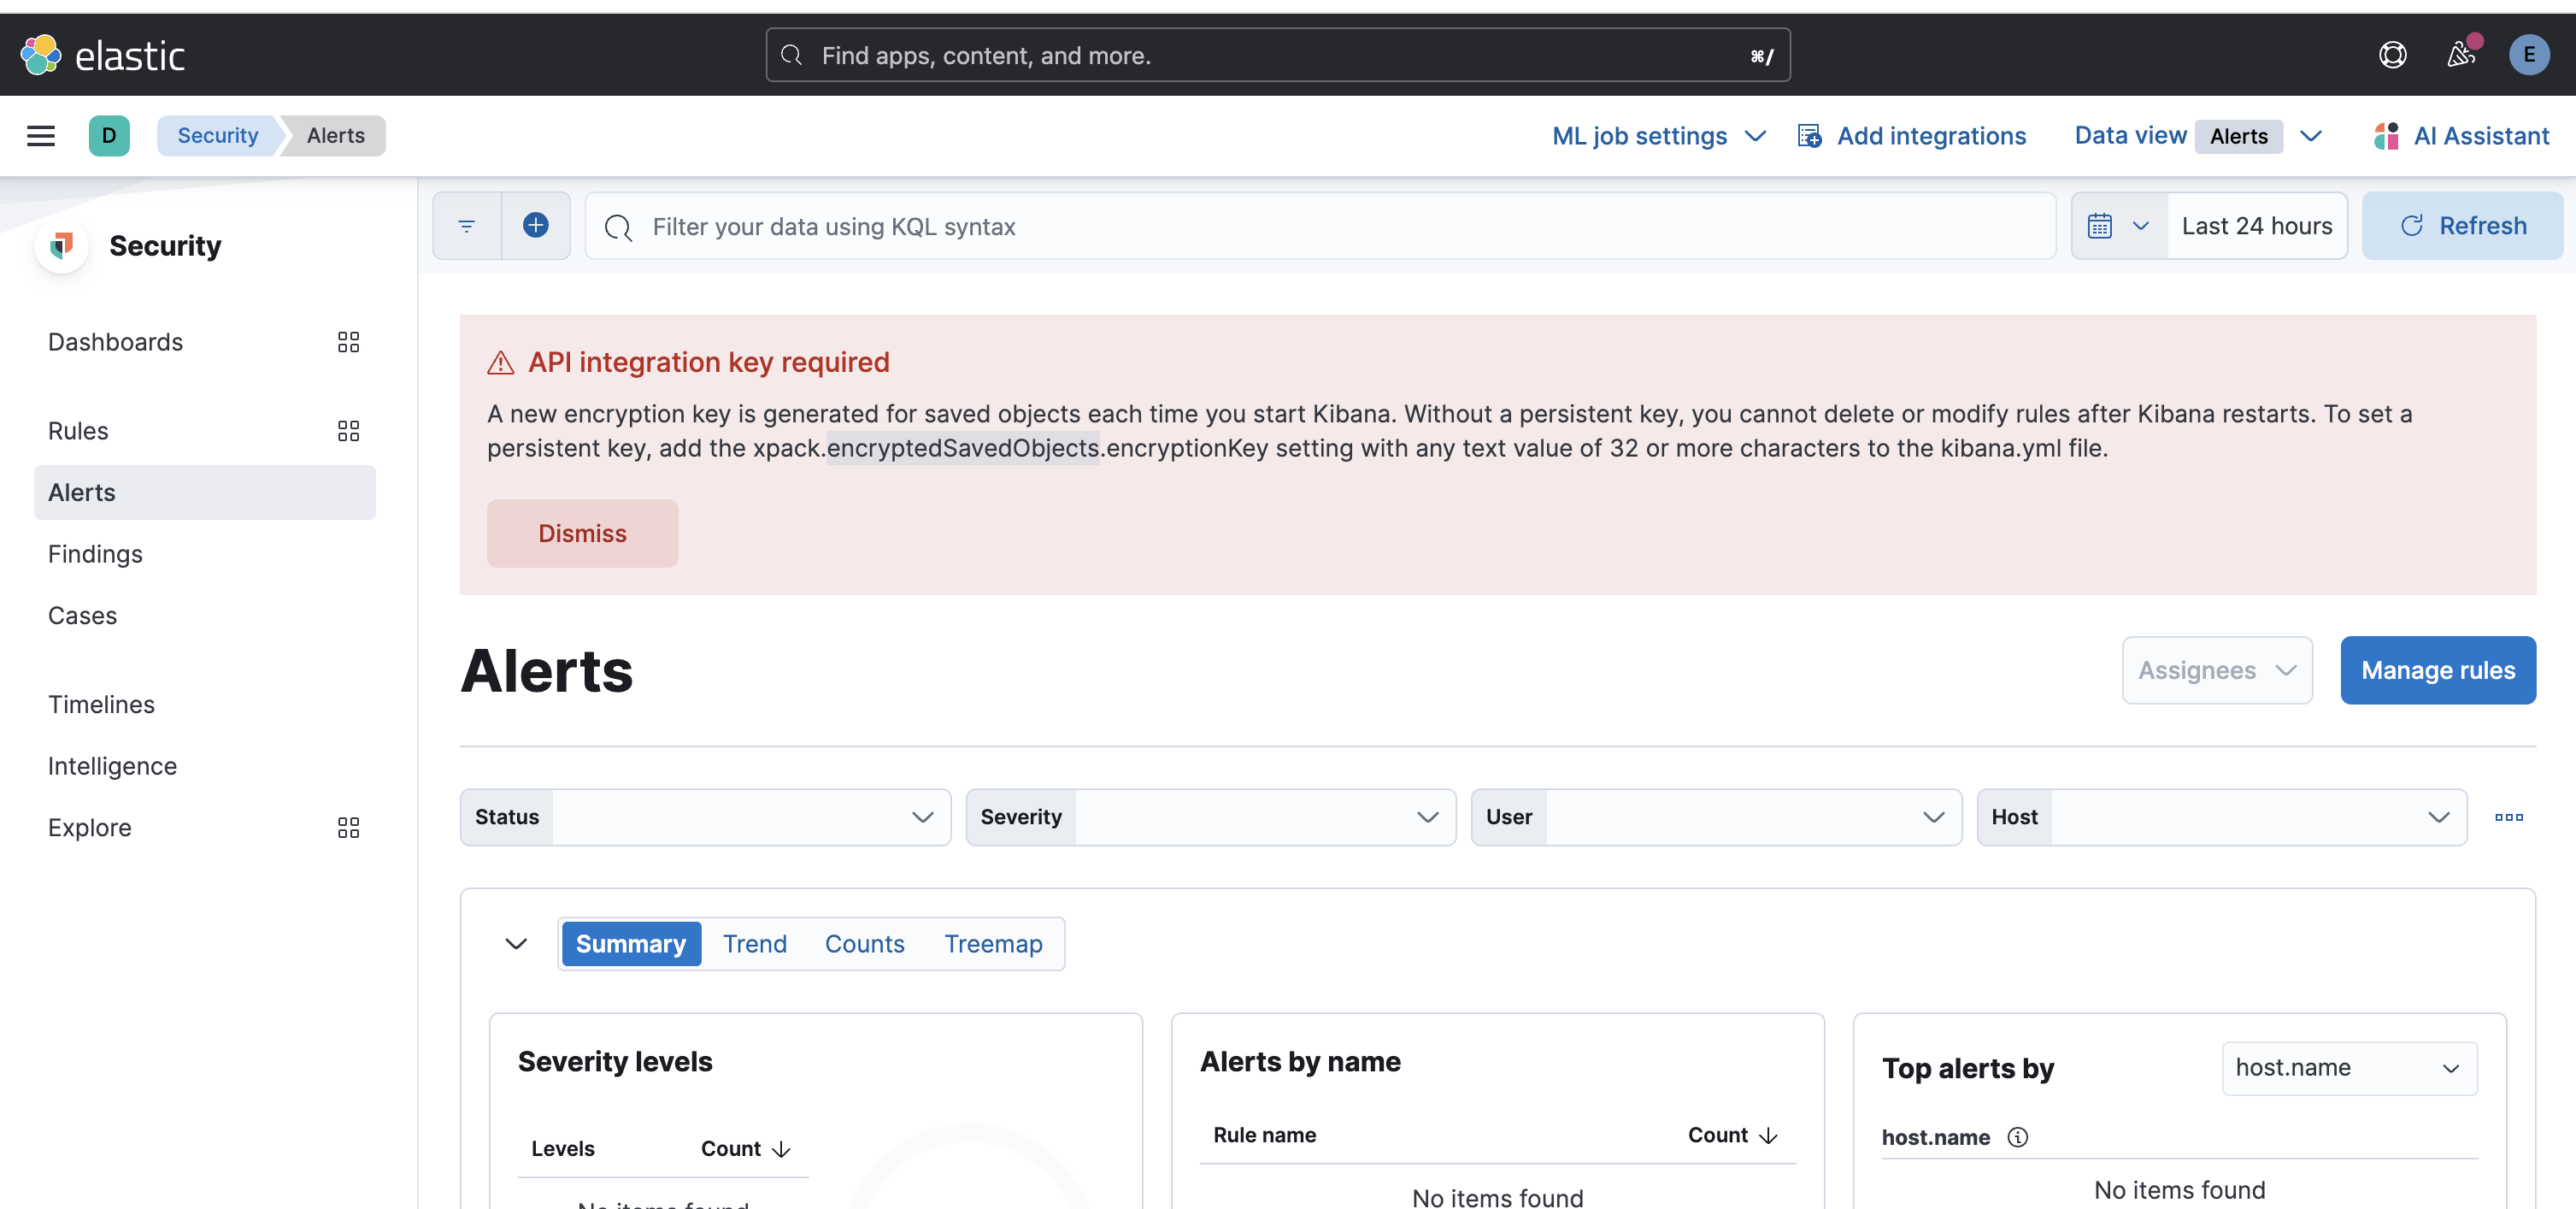
注意,如果有如下错误需解决,否则会无法查阅规则:
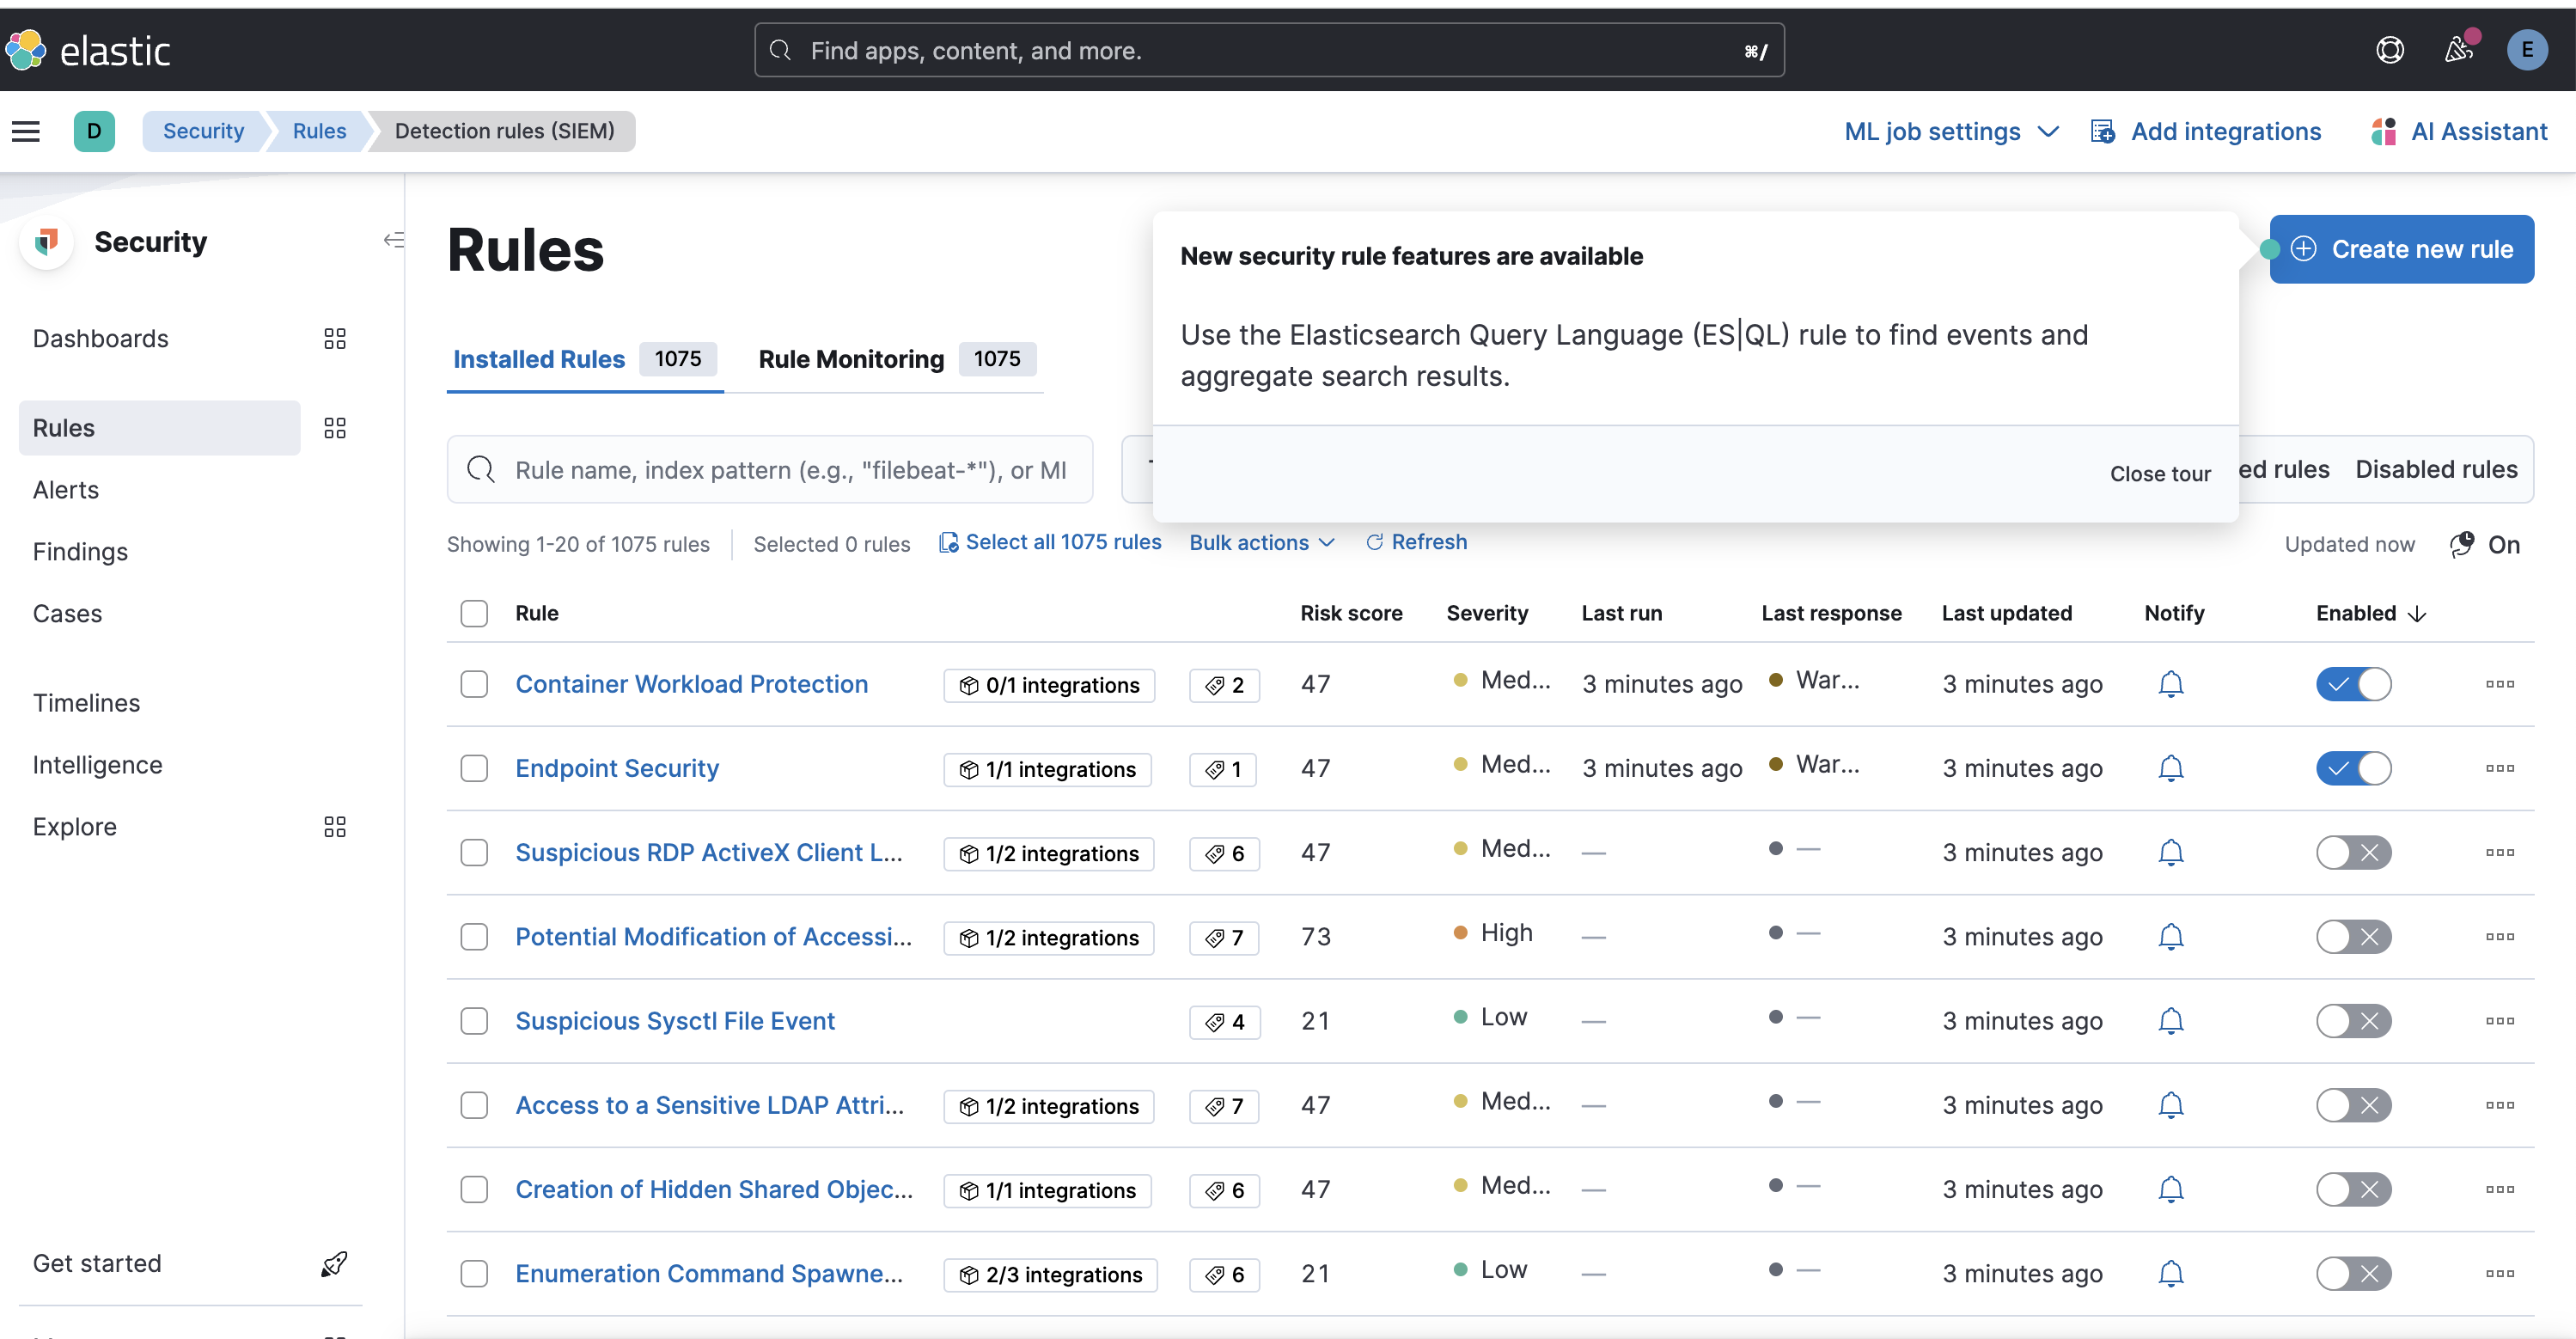
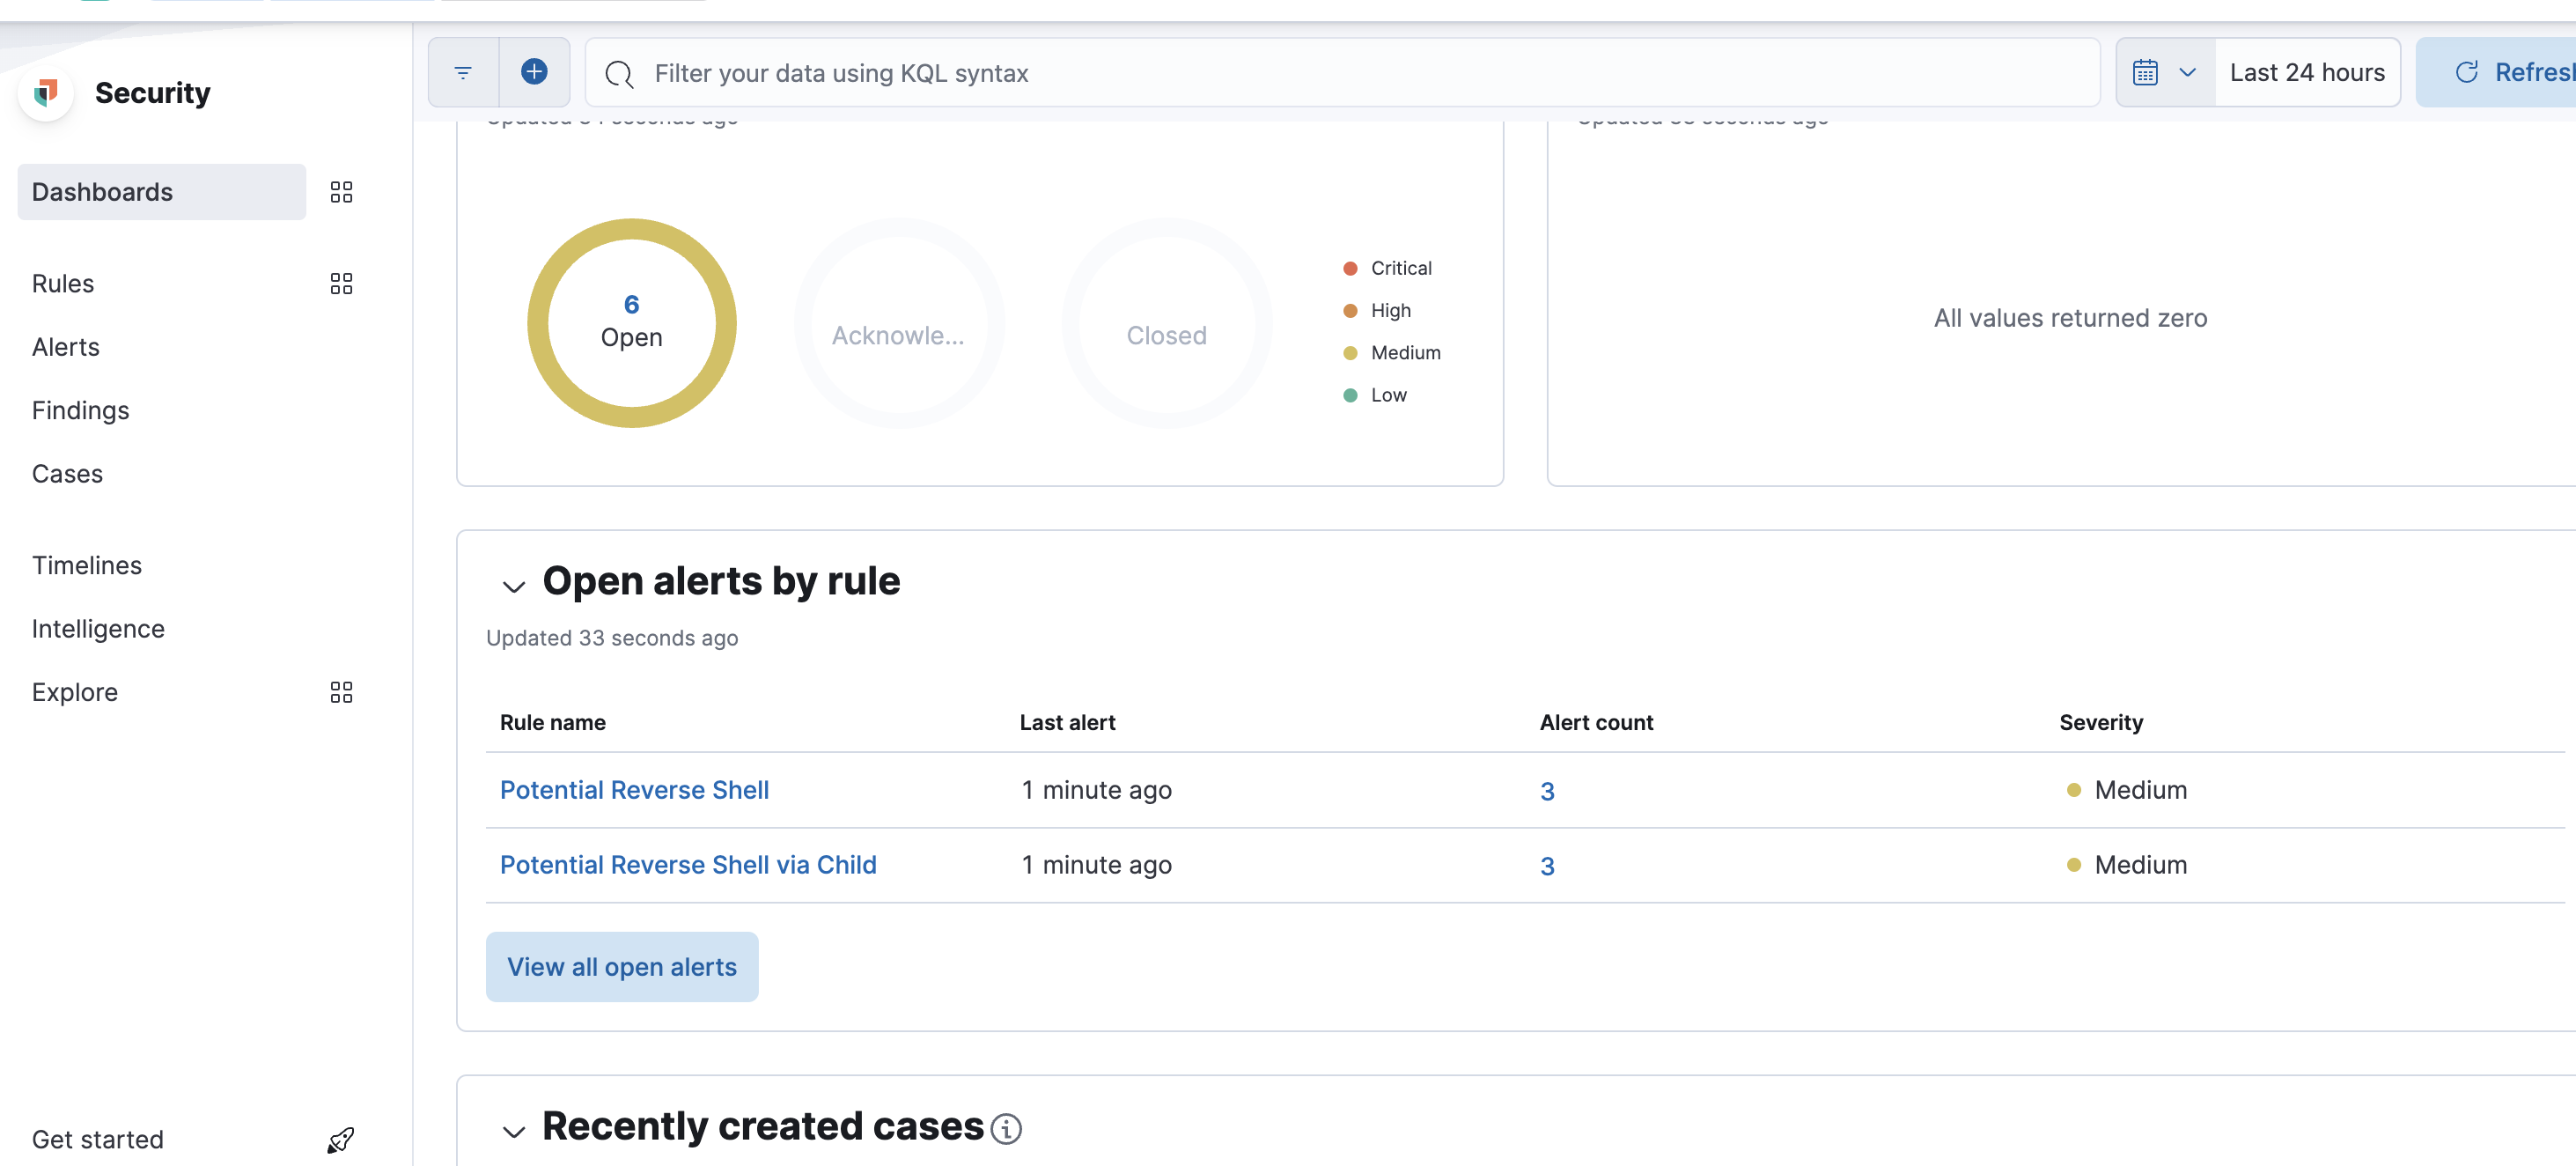
有些规则没开,记得开下,比如我把reverse shell规则打开后:Security->Dashboards->Detection & Response可以看到一些概览:
Windows事件管理器日志不是单纯的文本,因此需要借助一些工具来帮助我们完成采集的目的。这里使用winlogbeat(https://www.elastic.co/cn/beats/winlogbeat)完成。官方提供了很详细的安装文档(https://www.elastic.co/guide/en/beats/winlogbeat/current/winlogbeat-installation-configuration.html),核心就是配置想要记录的日志类型和对外传输的方案,这里我使用的方案为:
记录的日志类型,我没改,默认就是Security、Application,甚至还有Sysmon
对外传输,我使用了传输到elastic
配置好winlogbeat.yml后可以进行测试配置文件对不对:
.\winlogbeat.exe test config -c .\winlogbeat.yml -e下面为我的配置文件信息:
###################### Winlogbeat Configuration Example ########################
# This file is an example configuration file highlighting only the most common
# options. The winlogbeat.reference.yml file from the same directory contains
# all the supported options with more comments. You can use it as a reference.
#
# You can find the full configuration reference here:
# https://www.elastic.co/guide/en/beats/winlogbeat/index.html
# ======================== Winlogbeat specific options =========================
# event_logs specifies a list of event logs to monitor as well as any
# accompanying options. The YAML data type of event_logs is a list of
# dictionaries.
#
# The supported keys are name, id, xml_query, tags, fields, fields_under_root,
# forwarded, ignore_older, level, event_id, provider, and include_xml.
# The xml_query key requires an id and must not be used with the name,
# ignore_older, level, event_id, or provider keys. Please visit the
# documentation for the complete details of each option.
# https://go.es.io/WinlogbeatConfig
winlogbeat.event_logs:
- name: Application
ignore_older: 72h
- name: System
- name: Security
- name: Microsoft-Windows-Sysmon/Operational
- name: Windows PowerShell
event_id: 400, 403, 600, 800
- name: Microsoft-Windows-PowerShell/Operational
event_id: 4103, 4104, 4105, 4106
- name: ForwardedEvents
tags: [forwarded]
# ====================== Elasticsearch template settings =======================
setup.template.settings:
index.number_of_shards: 1
#index.codec: best_compression
#_source.enabled: false
# ================================== General ===================================
# The name of the shipper that publishes the network data. It can be used to group
# all the transactions sent by a single shipper in the web interface.
#name:
# The tags of the shipper are included in their field with each
# transaction published.
#tags: ["service-X", "web-tier"]
# Optional fields that you can specify to add additional information to the
# output.
#fields:
# env: staging
# ================================= Dashboards =================================
# These settings control loading the sample dashboards to the Kibana index. Loading
# the dashboards is disabled by default and can be enabled either by setting the
# options here or by using the `setup` command.
#setup.dashboards.enabled: false
# The URL from where to download the dashboard archive. By default, this URL
# has a value that is computed based on the Beat name and version. For released
# versions, this URL points to the dashboard archive on the artifacts.elastic.co
# website.
#setup.dashboards.url:
# =================================== Kibana ===================================
# Starting with Beats version 6.0.0, the dashboards are loaded via the Kibana API.
# This requires a Kibana endpoint configuration.
setup.kibana:
# Kibana Host
# Scheme and port can be left out and will be set to the default (http and 5601)
# In case you specify and additional path, the scheme is required: http://localhost:5601/path
# IPv6 addresses should always be defined as: https://[2001:db8::1]:5601
#host: "localhost:5601"
# Kibana Space ID
# ID of the Kibana Space into which the dashboards should be loaded. By default,
# the Default Space will be used.
#space.id:
# =============================== Elastic Cloud ================================
# These settings simplify using Winlogbeat with the Elastic Cloud (https://cloud.elastic.co/).
# The cloud.id setting overwrites the `output.elasticsearch.hosts` and
# `setup.kibana.host` options.
# You can find the `cloud.id` in the Elastic Cloud web UI.
#cloud.id:
# The cloud.auth setting overwrites the `output.elasticsearch.username` and
# `output.elasticsearch.password` settings. The format is `<user>:<pass>`.
#cloud.auth:
# ================================== Outputs ===================================
# Configure what output to use when sending the data collected by the beat.
# ---------------------------- Elasticsearch Output ----------------------------
output.elasticsearch:
# Array of hosts to connect to.
hosts: ["your_ip:9200"]
# Protocol - either `http` (default) or `https`.
#protocol: "https"
# Authentication credentials - either API key or username/password.
#api_key: "id:api_key"
username: "elastic"
password: "passwords"
# Pipeline to route events to security, sysmon, or powershell pipelines.
pipeline: "winlogbeat-%{[agent.version]}-routing"
# ------------------------------ Logstash Output -------------------------------
#output.logstash:
# The Logstash hosts
#hosts: ["localhost:5044"]
# Optional SSL. By default is off.
# List of root certificates for HTTPS server verifications
#ssl.certificate_authorities: ["/etc/pki/root/ca.pem"]
# Certificate for SSL client authentication
#ssl.certificate: "/etc/pki/client/cert.pem"
# Client Certificate Key
#ssl.key: "/etc/pki/client/cert.key"
# ================================= Processors =================================
processors:
- add_host_metadata:
when.not.contains.tags: forwarded
- add_cloud_metadata: ~
# ================================== Logging ===================================
# Sets log level. The default log level is info.
# Available log levels are: error, warning, info, debug
#logging.level: debug
# At debug level, you can selectively enable logging only for some components.
# To enable all selectors, use ["*"]. Examples of other selectors are "beat",
# "publisher", "service".
#logging.selectors: ["*"]
# ============================= X-Pack Monitoring ==============================
# Winlogbeat can export internal metrics to a central Elasticsearch monitoring
# cluster. This requires xpack monitoring to be enabled in Elasticsearch. The
# reporting is disabled by default.
# Set to true to enable the monitoring reporter.
#monitoring.enabled: false
# Sets the UUID of the Elasticsearch cluster under which monitoring data for this
# Winlogbeat instance will appear in the Stack Monitoring UI. If output.elasticsearch
# is enabled, the UUID is derived from the Elasticsearch cluster referenced by output.elasticsearch.
#monitoring.cluster_uuid:
# Uncomment to send the metrics to Elasticsearch. Most settings from the
# Elasticsearch outputs are accepted here as well.
# Note that the settings should point to your Elasticsearch *monitoring* cluster.
# Any setting that is not set is automatically inherited from the Elasticsearch
# output configuration, so if you have the Elasticsearch output configured such
# that it is pointing to your Elasticsearch monitoring cluster, you can simply
# uncomment the following line.
#monitoring.elasticsearch:
# ============================== Instrumentation ===============================
# Instrumentation support for the winlogbeat.
#instrumentation:
# Set to true to enable instrumentation of winlogbeat.
#enabled: false
# Environment in which winlogbeat is running on (eg: staging, production, etc.)
#environment: ""
# APM Server hosts to report instrumentation results to.
#hosts:
# - http://localhost:8200
# API Key for the APM Server(s).
# If api_key is set then secret_token will be ignored.
#api_key:
# Secret token for the APM Server(s).
#secret_token:
# ================================= Migration ==================================
# This allows to enable 6.7 migration aliases
#migration.6_to_7.enabled: true
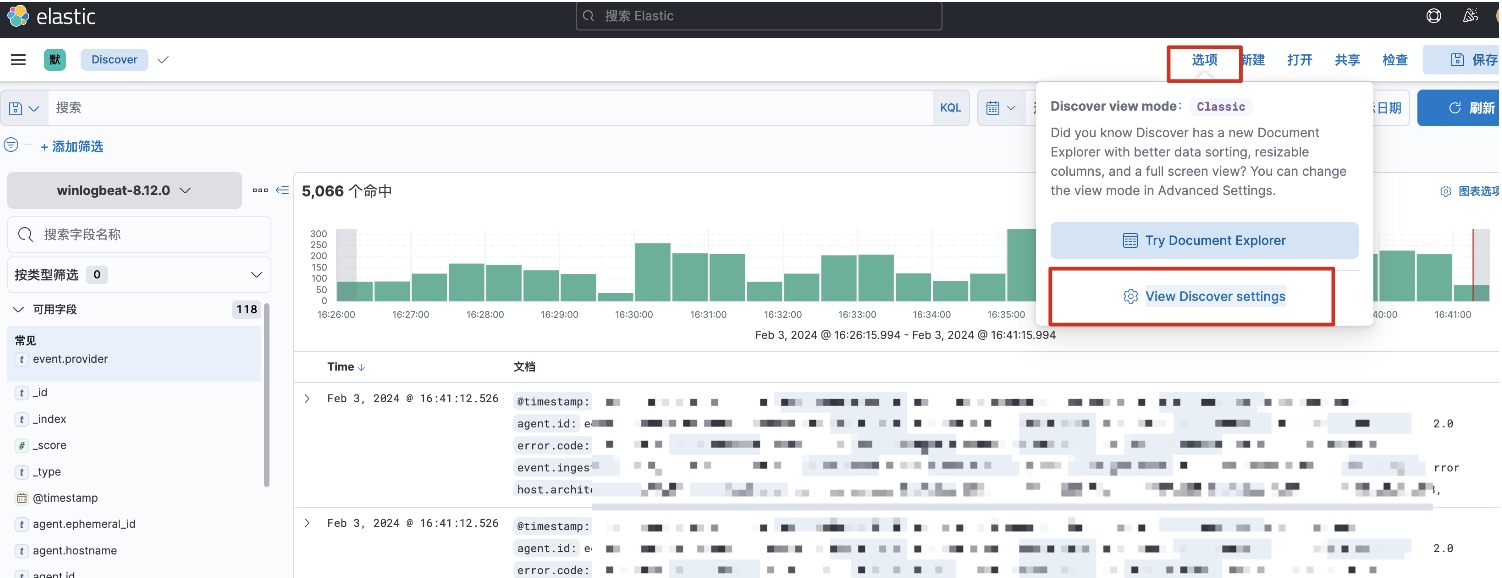
这时候,可能elastic上面搜不到数据,是因为winlogbeat使用了他自己的索引,默认为winlogbeat-version,笔者测试时,发现kibana上迟迟出现不了该索引,还以为数据传输没成功呢,因此通过如下手段进行排查,先获取es上面的索引信息:
http://your_ip:9200/_cat/indices?v发现有类似winlogbeat的索引信息:
yellow open .ds-winlogbeat-8.12.0-2024.02.03-000001 UpWhWCpdR-2WgMVe_kiH9A 1 1 192705 0 131.1mb 131.1mb
后面尝试在kibana上创建一个新的索引即可,v7.17.12版本的kibana创建索引的过程如下:discover->选项->View Discover settings
找到“索引模式”创建一个新的索引即可:
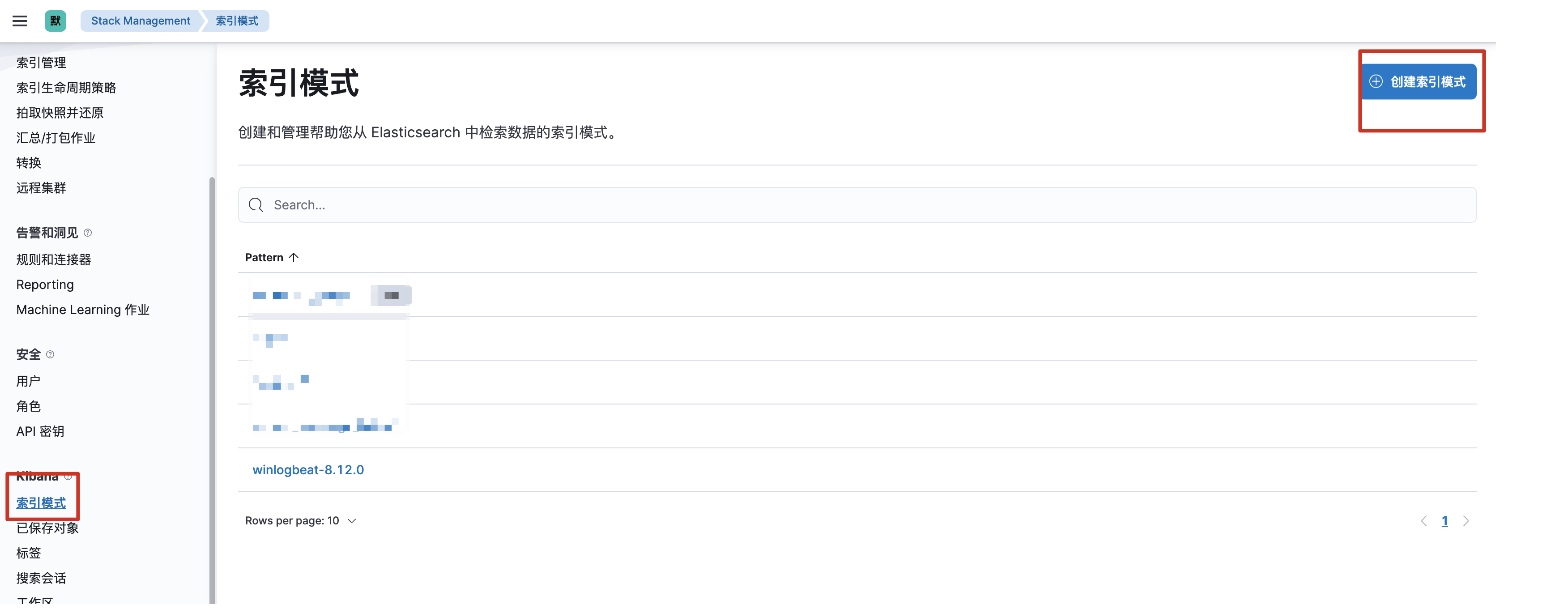
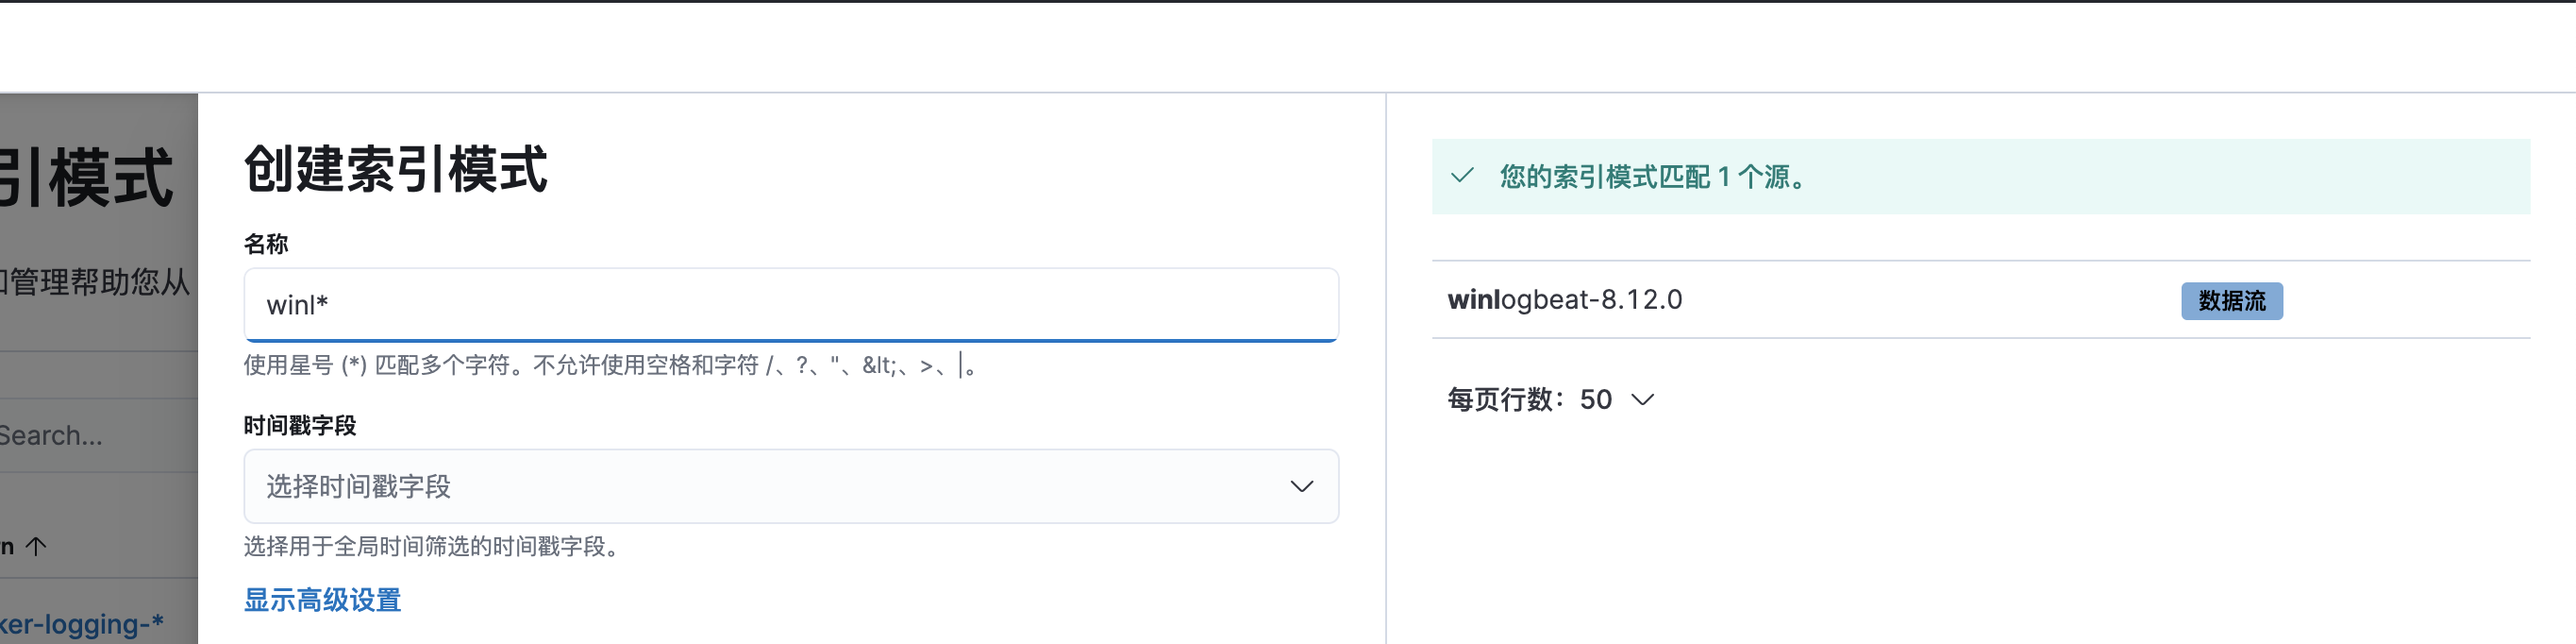
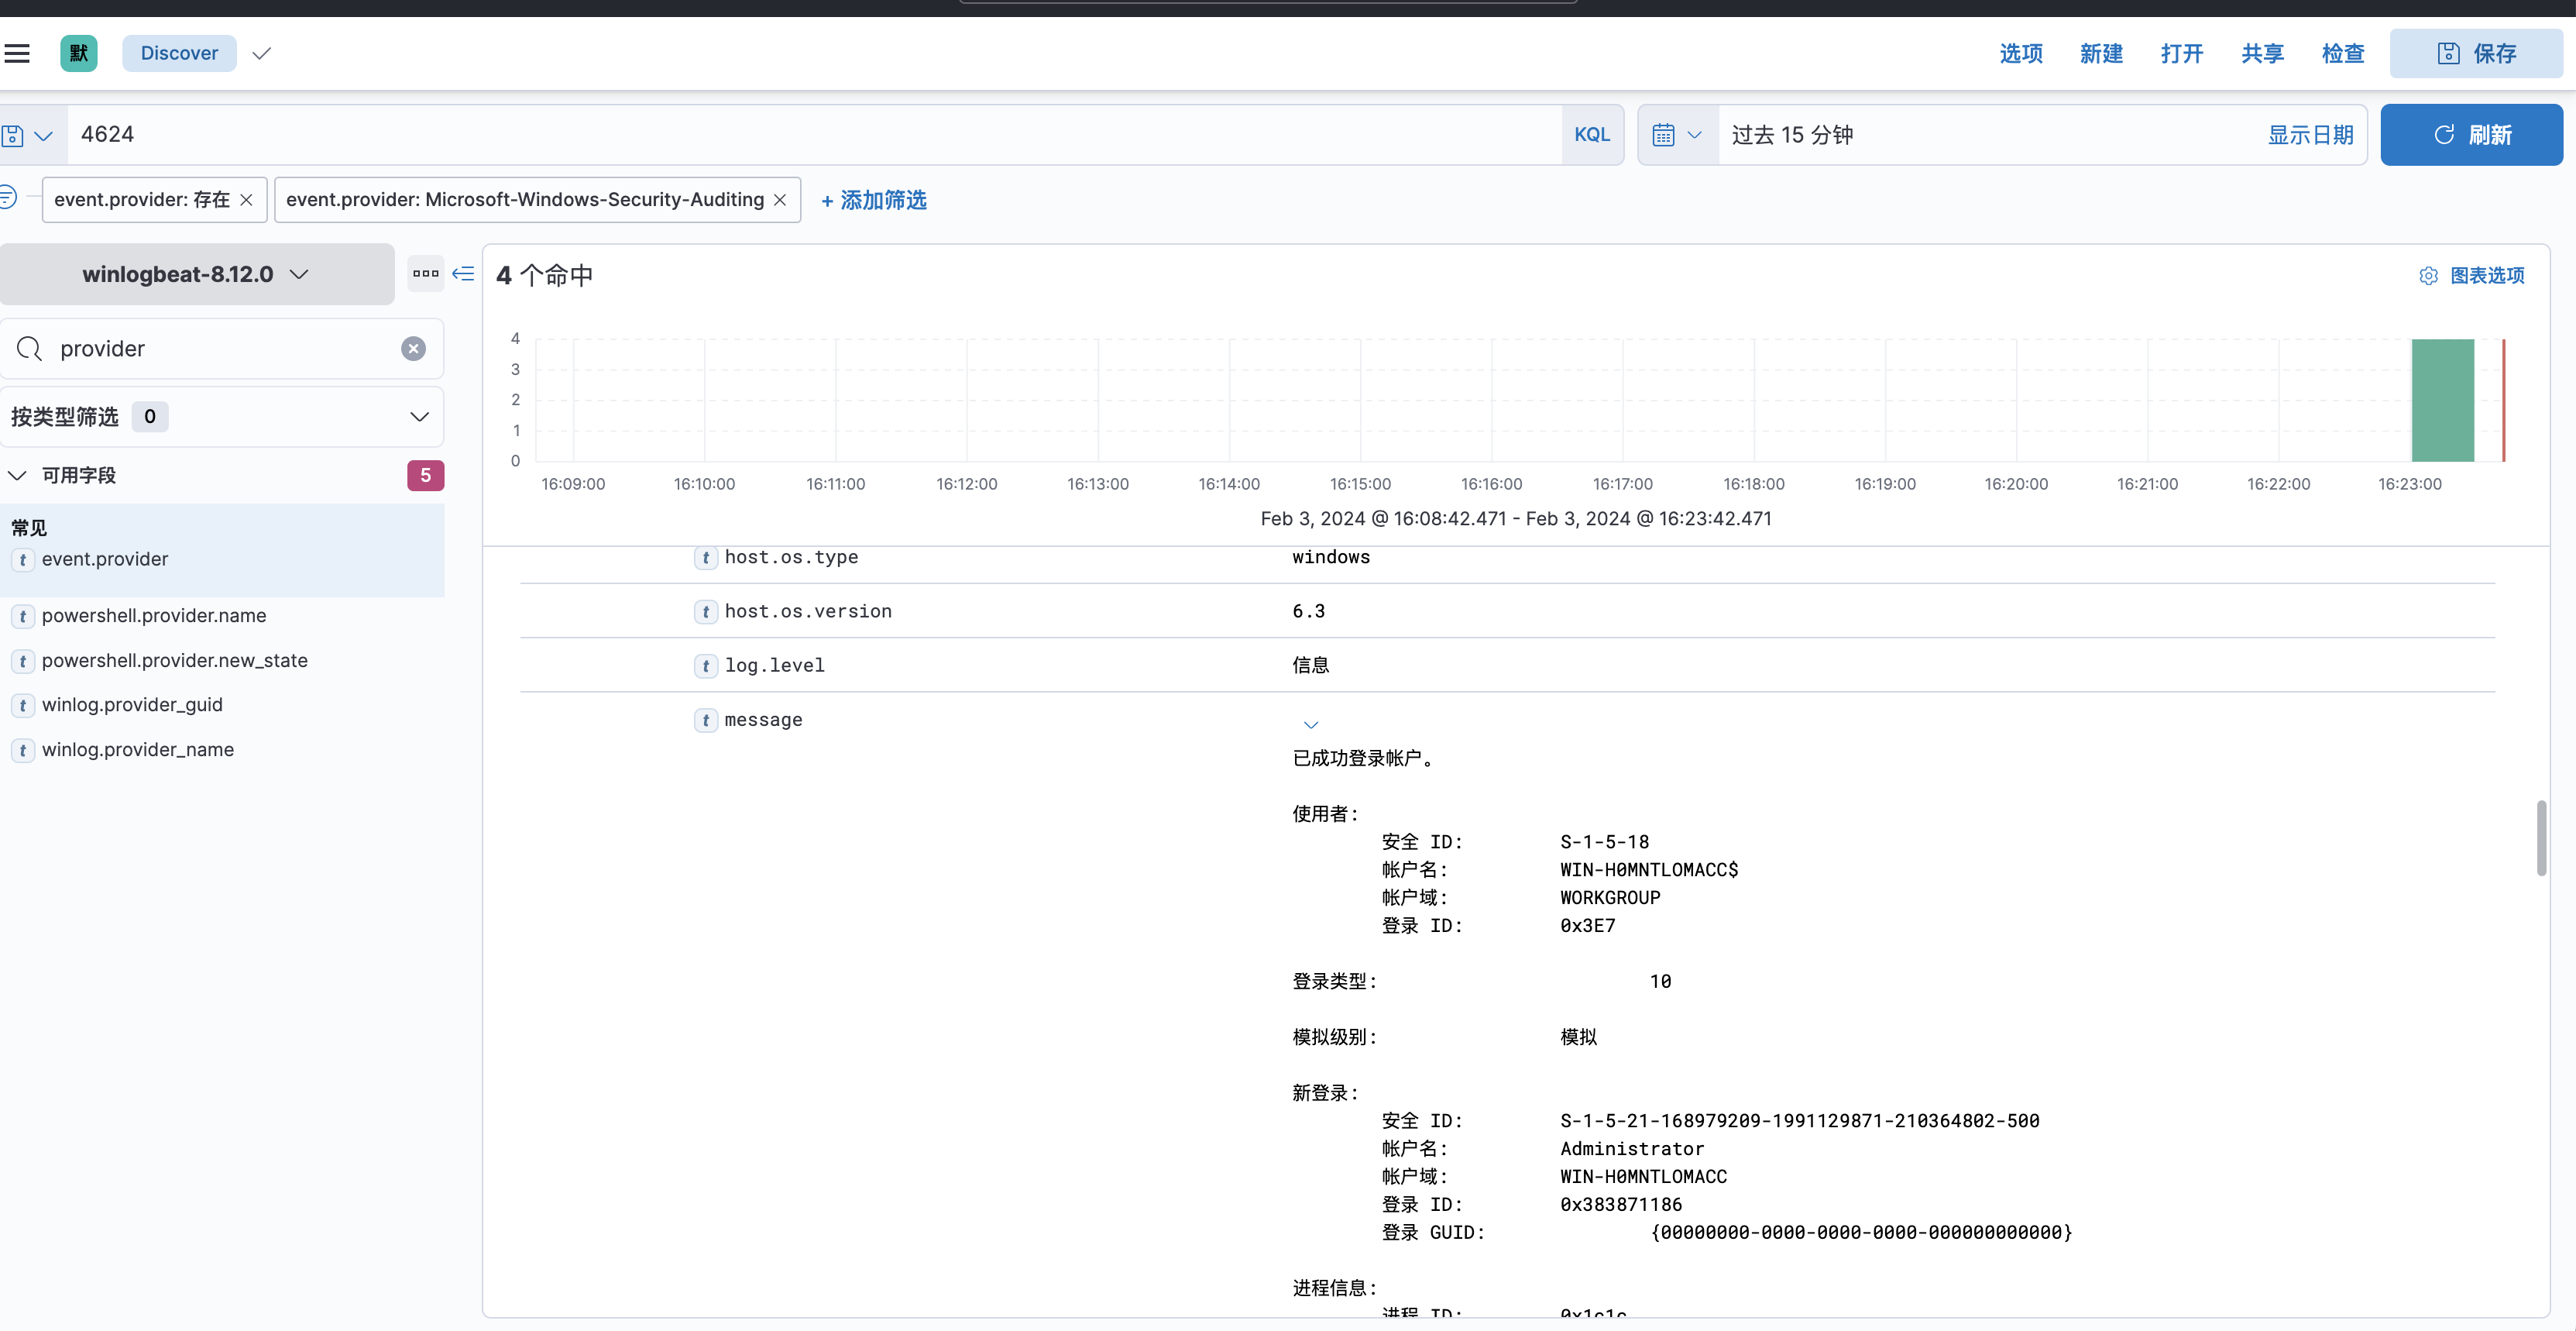
这时候就可以检索事件管理器日志了:
本课程最终解释权归蚁景网安学院
本页面信息仅供参考,请扫码咨询客服了解本课程最新内容和活动